Today’s Law Enforcement Agencies (LEAs) and related intelligence organizations are under siege on a number of fronts, and will need to change and evolve decades old, stove pipe practices and workflows to maintain their ability to detect and action credible intelligence derived from monitoring of communications networks.
This opening statement isn’t made flippantly or without empirical justification. Network users and Enterprises are becoming more sophisticated and concerned with personal privacy. This translates into an increase in the use of many forms of encryption on the network, such as VPNs or end point encryption techniques, which severely hamper (at best) or totally negate (at worst) the practice of LI. Called the ‘Going Dark’ problem by the industry, it is an area of great concern as it is seen to make the pursuit of justice increasingly blind.
Application development, deployment and use are increasing, driven by the adoption of mobile devices as a means to access the internet. In an LI context this equates to more complexity and variety in the traffic (more ‘bits’ to understand and build parsers for). And because mobile devices are so convenient, each user is typically generating more of this traffic without the need to be tied to a fixed access point.
Communication Service Providers, spurred on by the prevalence of ‘cool’ apps that their subscribers have made firm fixtures in their lifestyle, are increasing core and access fabric capacity, as seen by the global uptake and roll out of 4G, IMS, WiFi, Carrier Ethernet and 100G IP cores. This introduces the ‘Big Data’ problem, the effect of which is to make it difficult to identify suspects data/calls when there is so much more white noise data from normal users of the network.
Just how do analysts find the actionable intelligence in the data received from a subject of interest, when that subjects personal use of the network has potentially increased 10 fold, and they now have a web of unattributed cyber identities that they communicate with?
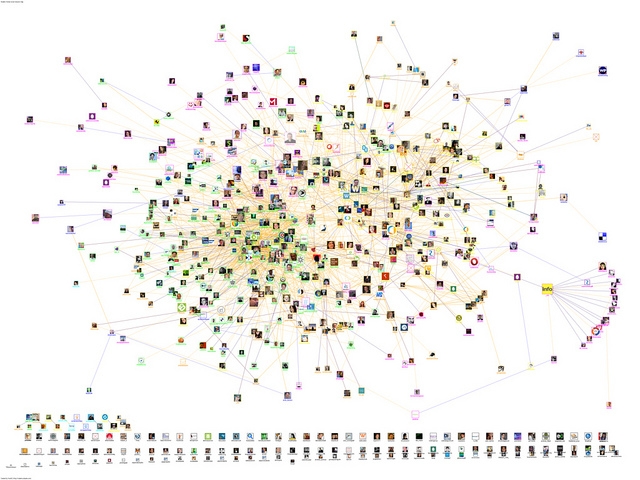
Understanding Big Data Sets with Visual Analytics
Visual Analytics is a vital new tool that facilitates understanding of Big Data sets, and allows analysts to determine relationships, anomalous patterns of behavior and flows of information quickly. With this tool, analysts can discount or focus on certain areas of a subset of the data, and discard the rest as irrelevant to their investigation.
This is an evolution of two fields of study—information and scientific visualization—that focuses on enabling analytical reasoning and insight through presentation of data using interactive visual techniques. Typically, visual analytics are used as a treatment of data whose innate complexity, massive size and multi-discipline analytical requirements (machine ‘pattern’ analysis coupled with human ‘intuition’ based analysis) make the problem otherwise impossible. To encompass the whole data set, consider the problem, and arrive at a conclusion is seen as intractable without these methods.
Visual Analytics has been coined the “science of analytical reasoning facilitated by visual interactive interfaces.” It integrates many new techniques with established approaches from research academia, to arrive at an informed result more quickly, despite the size and complexity of the data set. The ultimate aim in the LI context being the most accurate actionable intelligence, derived from communications information received under warrant, from the smallest application of effort/time of the analyst working the case.
In this way, Visual Analytics is considered one of the cornerstones of the scientific discipline of Analytical Reasoning – a practice which strives to assist in applying human judgments to reach conclusions from a combination of evidence and assumptions, and then display them using a number of different data/visual representations. These representations of the data transform potentially millions of rows of communications data (in the LI context) into a visible form that highlights important features, including commonalities, relationships and anomalies across the whole of a subjects use of the communications infrastructure. The goal of this analysis is often to derive intent of the subject(s) in their planning stage or capture evidence of wrong doing after the fact.
Paradigm Shift for LEAs
This kind of capability is a true paradigm shift for much of the law enforcement community, that have up until this point been relying on the analysts hard graft in interpreting the data using home grown tools, clever use of Excel and pivot tables, or even in some cases paper based comparisons. These methods still hold some validity, but not when applied to the Big Data set.
Visual Analytics should be viewed as a way of sifting the white noise and arriving at preliminary conclusions, after which these other treatments of the exposed critical subset of the data can be used to validate the hypothesis (in this context, guilt of the subject or confirmation of intent).
Ultimately the analyst will be structuring their view and investigation of the data as a series of why, what and how questions. The responses to these questions will define the Visual Analytic technique to use and a large majority of the work flow to follow in reaching a conclusion. Future blogs on specific instances of the Visual Analytics techniques will adhere to this ‘question’ based format, with working examples and the thinking behind them.
Why
- Why do we need to use an Analytic technique?
- To describe something [inventory of ‘x’]
- To test an hypothesis and prove/disprove it
- To predict an outcome based on collected results/data – this is typically where Visual Analytics will be used
What
- What is the question you are trying to answer?
- What are the results of initial analysis/exploration?
How
- How is the data being collected?
- Observation
- Sampling
- This naturally standardizes observed data into categories
- Experimentation [this is the most relevant to the LI context]
- Where we manipulate the environment to control conditions and standardize them such that results are not influenced by external factors [i.e. in the LI context, application of a standardized access function in the network and a clearly defined data handover specification]
- How do you want the data to be formatted/presented?
- How is the small/medium/large data set to be modeled for additional deep/follow-on analysis?
How are the final results to be shown?
How this works in practice will be the subject of my next blog, as we look at a working example of Grid Analysis in conjunction with Social Graphs and Social Network Analysis (SNA), all Visual Analytics techniques. These treatments if the data will be used to demonstrate filtering a huge data set and then visually showing the relationships in the data and how they can be further coalesced through the collapse of multiple cyber identities attributable to single users or groups, into physical actors/suspects of interest.
—
Brett Taylor
Senior Sales Engineer, SS8
About SS8 Networks
SS8 provides Lawful Intelligence platforms. They work closely with leading intelligence agencies, communication providers, law enforcement agencies and standards bodies and their technology incorporates the methodologies discussed in this blog. Xcipio® is already proven to meet the very high demands of 5G and provides the ability to transcode (convert) between lawful intercept handover versions and standard families. Intellego® XT natively supports ETSI, 3GPP and CALEA handovers, as well as national variants. Intellego XT’s MetaHub component is a best-in-class data analytics tool. Both product portfolios are used worldwide for the capture, analysis and delivery of data for the purposes of criminal investigations.